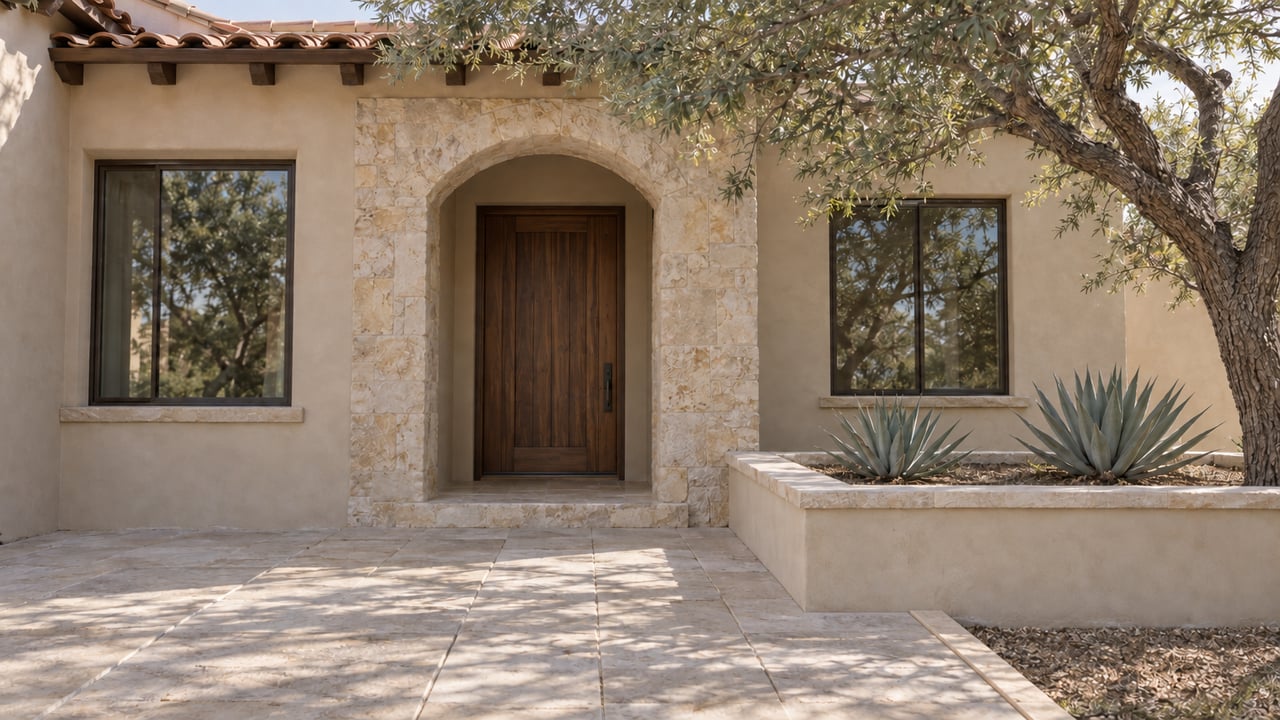
Two addresses on the same short stretch of road tell you almost everything about why Moon Valley's price data behaves the way it does. One is a 2,457 square foot house on West Moon Valley Drive that last changed hands in September 1981 for $168,700. Redfin's automated model now puts its value near $822,000, still about 13 percent below the average of the six comparable sales used to build that estimate. A few streets over, a 21-plus acre hillside property spanning four parcels, restored over four years from its original 1962 build, carries a Redfin estimate of roughly $3 million, nearly triple the $1.02 million average of its own comparable set.
Both homes sit inside the boundary that gets marketed as one neighborhood. Both would, in theory, count toward the same median if they sold in the same reporting window. That single fact is the reason Moon Valley's headline price numbers keep contradicting each other, and it matters to anyone using those numbers to decide what to offer or what to ask.
The Number That Went Up While the Decline Got Worse
In June 2025, Redfin recorded a median sale price of $793,000 for Moon Valley, down 3.9 percent from the year before. By March 2026, the reported median had climbed to $835,000, a $42,000 increase in dollar terms. Yet the year-over-year comparison attached to that March figure showed a 12.0 percent decline, not an improvement.
A price can rise in absolute terms while its year-over-year comparison gets worse if the prior-year comparison point was unusually high, and in a market this small, one or two expensive closings in the comparison month can set that bar. The dollar figure went up. The percentage got worse. Neither statement is wrong. Both are describing a market where the sample is too small to behave the way medians do in larger, more liquid submarkets.
The same report showed median price per square foot at $339, up 21.9 percent year over year, in the same month the total median price was reported down 3.9 percent. A rising per-square-foot figure alongside a falling total price only happens one way: the mix of homes that happened to sell that month shifted toward smaller or lower-value properties even as each of those properties commanded more per square foot than comparable homes had the year before. The market was not necessarily getting cheaper. The sample was getting different.
Why the Sample Keeps Changing
Moon Valley is not a high-volume neighborhood. Redfin counted 14 closed sales in June 2025, up from 9 in June 2024. In other stretches, the same tracker has shown as few as two closed sales for the entire neighborhood in a single month.
Flip a coin four times and three heads is unremarkable. Flip it four thousand times and the ratio settles down close to even. Moon Valley's monthly sales count sits much closer to four flips than four thousand, and a median calculated from nine to fourteen transactions moves whenever the specific nine or fourteen change character, not just when values genuinely shift.
This is the mechanism behind every confusing headline coming out of this neighborhood. It is not that Redfin, Homes.com, or any other source is measuring incorrectly. It is that a thin market produces medians that describe last month's particular buyers and sellers more than they describe an underlying trend.
What Actually Sold, and at What Price
The range of product inside the Moon Valley name explains why the sample swings so hard. Townhomes near the country club have listed as low as $299,900 to $330,000. Established single-family resale, mostly 1960s and 1970s ranch and Mediterranean-influenced construction, has typically priced in the mid-$400,000s to $700,000 range. Custom homes on or near the golf course, particularly those that have been substantially remodeled, routinely list from around $1.2 million past $3 million.
| What sold | Approximate price band |
|---|---|
| Townhomes near the country club | $299,900–$330,000 |
| 1960s–1980s ranch resale | roughly $450,000–$700,000 |
| Remodeled or golf-frontage custom | $1.2 million–$3 million+ |
Homes.com's separate townhome-specific data put Moon Valley's overall median at $640,000 over a trailing 12-month window through May 2025, up 2 percent year over year, a figure that sits meaningfully below Redfin's June 2025 median of $793,000 for the same general neighborhood. Different platforms, different sampling windows, different medians. That gap alone should be a signal that no single number here deserves to be treated as settled fact.
As of September 2, 2026, active listings told yet another version of the story: 21 homes on the market, a median list price of $538,000, and an average of 65 days on market before going under contract. A list-price median that much lower than the sold-price median reported for March 2026 suggests the current crop of active inventory skews toward the smaller, less expensive end of the range, exactly the kind of mix shift that has been driving the volatility all along.
A Second Market Inside the Same Name
Moon Valley Gardens, a distinct pocket that Redfin tracks separately, shows the identical pattern at a different price point. Over the three months ending in August 2026, its median sale price was $375,000, down 8.5 percent year over year, while its median price per square foot was $292, up 41.1 percent over the same period. Median down, per-square-foot up, in a market with its own separate, smaller sample. The same statistical fragility shows up wherever the sales count stays low enough for a handful of closings to swing the average.
Moon Valley Country Club, anchoring the neighborhood's center at 151 West Moon Valley Drive, adds one more layer of variation. Members play either the 18-hole championship course or the executive Moon Walk course, a shorter par-54 layout built in 1986. Golf frontage is not one product inside this neighborhood any more than the housing stock is one price tier. A fairway lot means something different depending on which fairway, on which course, behind which era of house.
What This Means Before You Write an Offer
A buyer comparing Moon Valley to other North Phoenix neighborhoods using a single median number is comparing an average of very different things, not a consistent product. The useful question is not "what is Moon Valley's median" but "what did homes like this specific one actually sell for in the last few months." A seller with a remodeled golf-frontage custom home should not price off a median that is being dragged down by townhome and starter-ranch closings any more than a townhome seller should price off comps built around a hillside estate.
Before treating any published Moon Valley figure as a market signal, it is worth asking a few direct questions. How many total sales make up the number being quoted. Whether the comparison period includes an unusually high or low outlier that could be skewing the year-over-year math. And whether the comps being used actually match the home in question by era, size, and lot type, rather than just by neighborhood name.
None of this means Moon Valley is a bad place to buy or sell. It means the neighborhood's real estate math only makes sense at the level of the individual home, not the headline. A handful of closings on comparable homes carries more information than a neighborhood median drawn from a dozen sales that look nothing alike.
If you are trying to make sense of what a specific Moon Valley property is actually worth, or whether now is the right window to list one, The Cryb Collective can walk through the real comps behind the headline with you.
